This post is for application developers who need to figure out where memory is going on a server.
An application service typically run as a server process; which in turn relies on the OS kernel. A process eats memory; and so does the OS kernel. The amount of memory that OS/kernel level functions are eating, depends on what the application service is doing. For example disk I/O, network calls, image manipulation etc.
So how do we get a clearer picture of where the memory is going?
Basic
free
free -m
shows high level overview of memory usage. You may be tempted to consider values in first row (Mem) as representing the free/used memory. However, the effective used/free memory is in the second row, as outlined in white below:
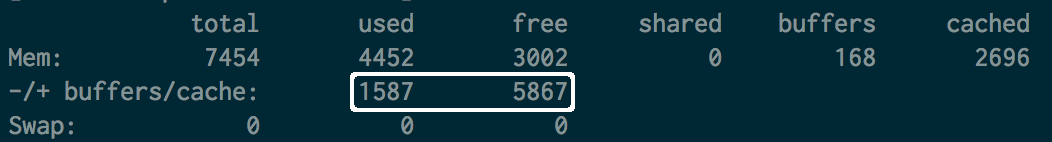
Note that the used memory does include reclaimable memory that the kernel is currently using. (more about this below)
top & ps
top followed by ^M
shows the running processes sorted by memory consumed
ps aux | sort -nk +4 | tail ^
shows top processes consuming memory
Dig deeper
free/top/ps ought to be enough most of the times especially when we're interested in just our processes. However, to get a clearer picture of how much our application processes may be driving up the kernel's memory consumption we need to look at other places too.
meminfo
cat /proc/meminfo
shows a lot of information about memory usage and is whats internally used by free/top/ps. If you feel unsatisfied by what free/top/ps are reporting, then meminfo ought to be a great jumping off point to dig more. Details on what each entry in there means are below:
Of special interest here are slab values which are worth repeating from above:
- Slab: in-kernel data structures cache
- SSReclaimable: Part of Slab, that might be reclaimed, such as caches
- SUnreclaim: Part of Slab, that cannot be reclaimed on memory pressure
The above is essentially reporting on memory consumed by kernel for storage of objects such as semaphores, process descriptors, file objects etc. This dated whitepaper gives some history and details which seem worth eyeballing.
So, whats interesting here? If these slab values are high then its possible that your application process is doing stuff which is making the kernel consume more memory. Other than looking at ways in your application code to work smarter, what you need to do is give enough headroom memory for the kernel to work. In other words, after having allocated memory for your application server process, ensure that there is enough memory left on your machine for the kernel to work without suffocation. Also, high memory consumtion could be an indicator of improper resource usage code in your application; for example not closing network of file I/O streams.
You may read see a high SSReclaimable value and think that all is good but we're warned here that:
not all reclaimable slab will be reclaimable, due to items being in use. The impact of those factors will vary from system to system.
Whats in the Cache?
cat /proc/slabinfo
shows what the hell really is in the slab. Things like active_objs and objsize can give precise details on how much memory is going where. But wait! there is an easlier way to sort through the slab allocation.
slabtop -s c
shows kernel slab cache information in real time. Pretty cool, eh? (the "-s c" param is simply sorting by cache size so the topmost entry is the heaviest)
Getting it back
sudo sh -c 'sync && echo 3 > /proc/sys/vm/drop_caches'
clears the cache. There are a few options on how to invoke this. This may not be a great idea as clearing the cache while its potentially being used could cause expected behavior. More importantly, it won't really solve the problem. If you app server's activities are causing Slab pileup and you clear the cache, chances are that it'll just pile up again.
sudo sh -c 'echo 5000 > /proc/sys/vm/vfs_cache_pressure'
cache_pressure controls how passively or agressively kernel frees up memory taken this Slab cache. By default its 100 which is "fair". Decreasing it causes cached values to be retained more. Increasing it causes memory consumed by these caches to be reclaimed more.
Want more?
In that case, we could even explore memory allocation of individual processes. For that we'll peek into /proc which is a pseudo filesystem that gives process level information. Its mostly readonly and man proc will give you a lot to read but here is a start:
cat /proc/[pid]/status | grep Vm
shows some process level memory information and if you're down this far down this article, you might want to geek out on the meaning of those values.
cat /proc/[pid]/statm
also shows process level memory allocation. Find statm on this page for more details on the output from this.
Lastly here is a handy script which shows some of these stats on a system and for a process:
Example Output for monmem java 60 :
Mon Mar 10 07:22:51 EDT 2014

PID %MEM COMMAND
4049 34.0 /usr/bin/java
657 0.0 [xfssyncd/xvdb]
643 0.0 [xfs_mru_cache]
647 0.0 [xfslogd/3]

             total       used       free     shared    buffers     cached
Mem:         34173      17301      16872          0         13       4249
-/+ buffers/cache:      13038      21135
Swap:            1          1          0

Slab:             681856 kB
SReclaimable:     558384 kB
SUnreclaim:       123472 kB

VmPeak:	34105280 kB
VmSize:	33843008 kB
VmLck:	       0 kB
VmHWM:	11923828 kB
VmRSS:	11923828 kB
VmData:	33682352 kB
VmStk:	      88 kB
VmExe:	       4 kB
VmLib:	   13912 kB
VmPTE:	   25424 kB
VmSwap:	      0 kB